


Workspace solutions to your office
Invensol SAM is a smart solution for managing your colleagues desks, devices, and spaces efficiently. It helps you create a flexible workspace that constantly adapts to your needs.
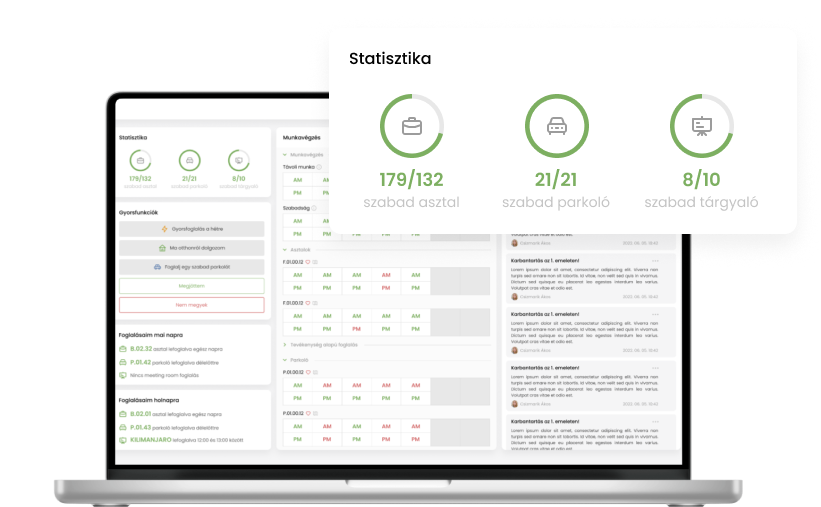
Workspace solutions to your office
Invensol SAM is a smart solution for managing your colleagues desks, devices, and spaces efficiently. It helps you create a flexible workspace that constantly adapts to your needs.